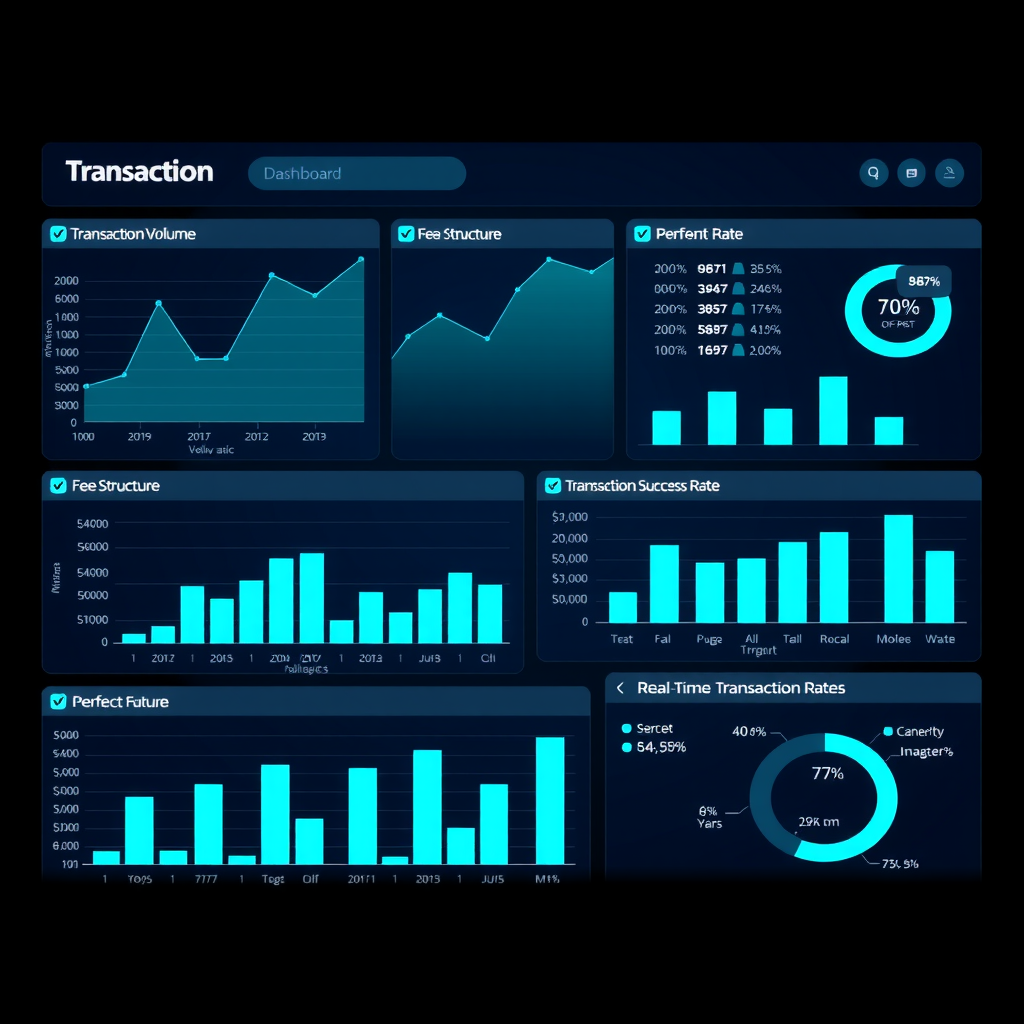
Transaction Analytics Dashboard
Explore detailed transaction analytics with our powerful visualization tools. Analyze transaction patterns, volume trends, and fee structures across the Solana network.
Comprehensive Transaction Intelligence
Our Transaction Analytics Dashboard provides deep insights into blockchain activity across the Solana network. Whether you're a researcher, analyst, or institutional user, our platform delivers the comprehensive transaction intelligence you need for informed decision-making and strategic planning.
The dashboard leverages advanced data processing algorithms to transform raw blockchain data into actionable insights. Every transaction is analyzed, categorized, and presented through intuitive visualizations that make complex patterns immediately apparent.
Historical Data Comparison
Access extensive historical transaction data spanning multiple years of Solana network activity. Our platform maintains a comprehensive archive that enables you to compare current trends against historical patterns, identify cyclical behaviors, and understand long-term network evolution.
The historical comparison tools allow you to overlay different time periods, examine year-over-year growth, and analyze how network upgrades and market conditions have influenced transaction patterns. This temporal perspective is invaluable for forecasting and strategic planning.
Key Features
- ✓Real-time transaction monitoring
- ✓Volume trend analysis
- ✓Fee structure insights
- ✓Success rate tracking
- ✓Peak usage identification
- ✓Program interaction analysis
Advanced Filtering
Filter transactions by time periods, transaction types, and program interactions to gain precise insights tailored to your research needs.
Transaction Pattern Analysis
Identify recurring patterns in transaction behavior across different time scales. Our pattern recognition algorithms detect daily cycles, weekly trends, and seasonal variations that can inform trading strategies and network capacity planning.
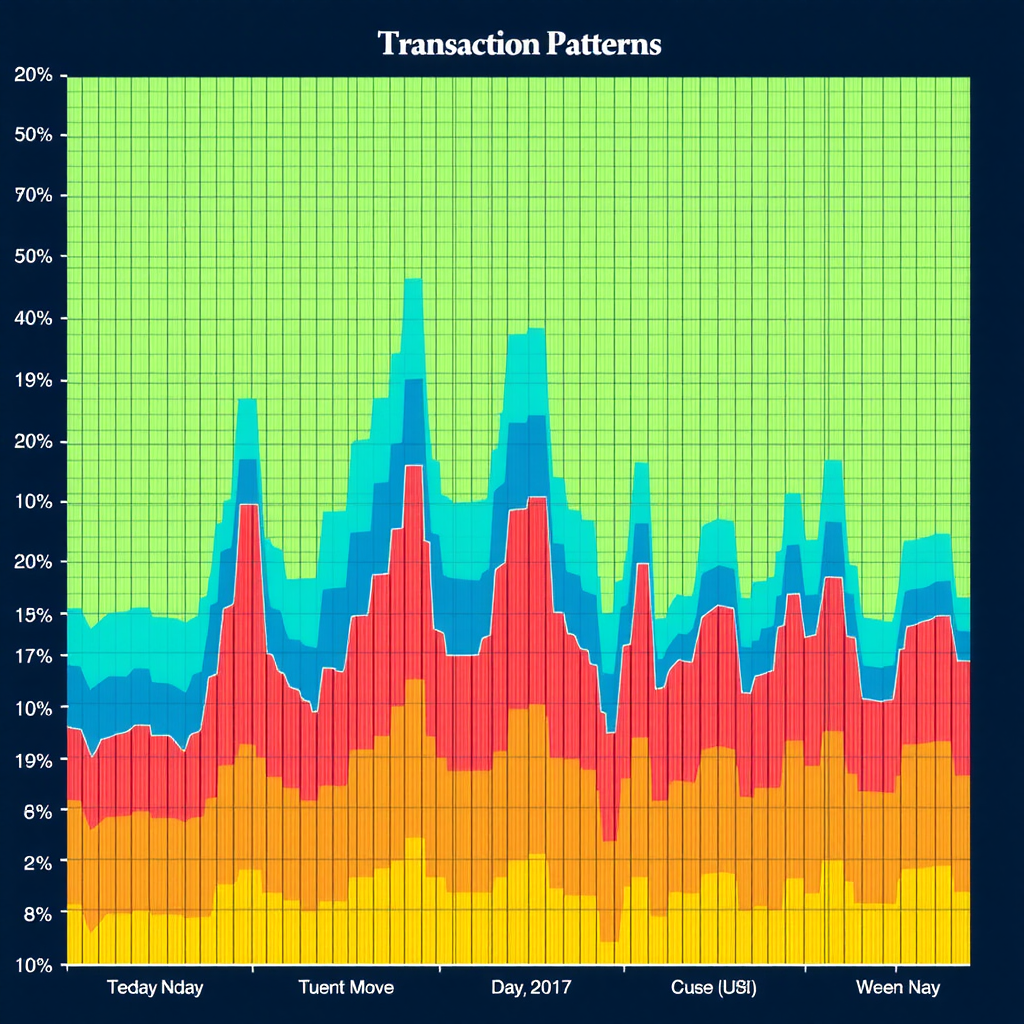
The dashboard highlights anomalies and unusual activity spikes, helping you stay ahead of market movements and network events. Pattern analysis extends to transaction types, allowing you to understand which operations dominate network usage during different periods.
Volume Trend Visualization
Track transaction volume trends with precision through interactive charts and graphs. Our visualization tools present data in multiple formats including line charts, area graphs, and bar charts, each optimized for different analytical perspectives.
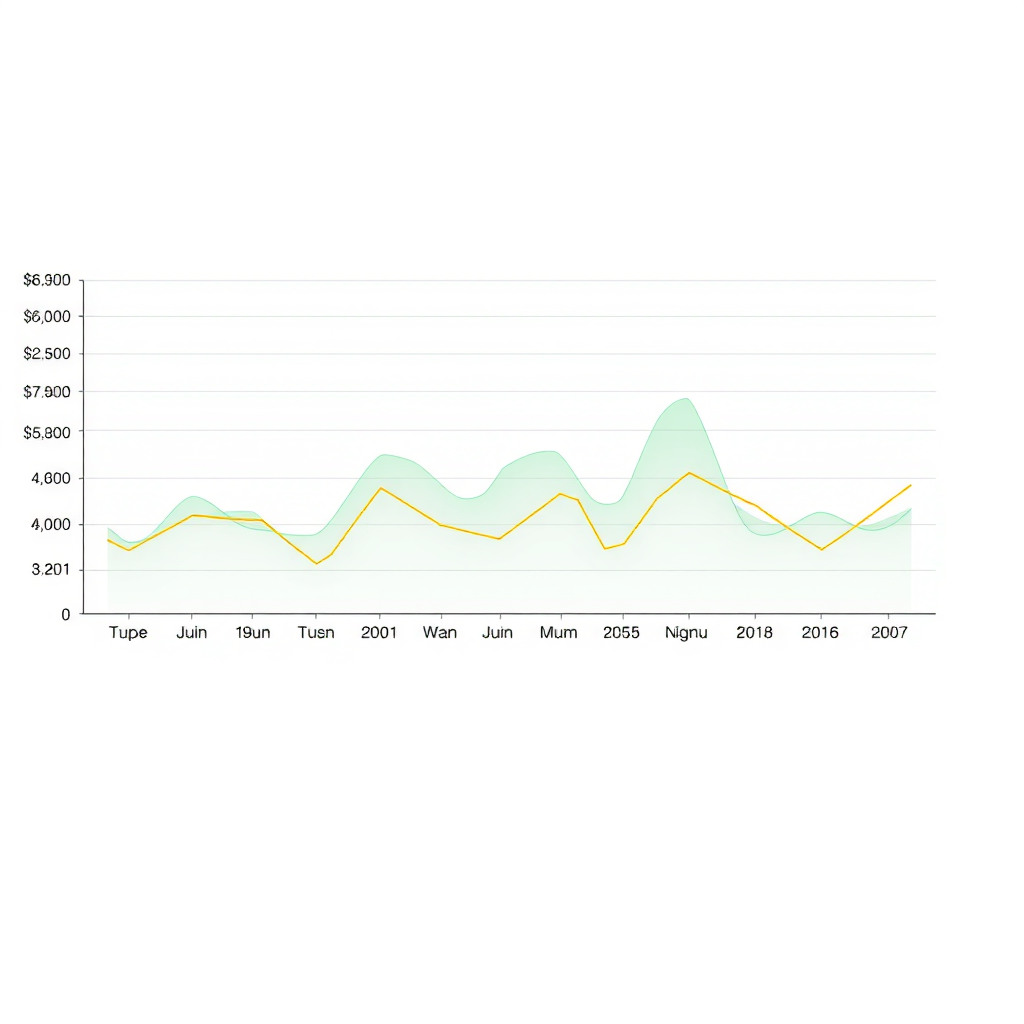
Volume analysis includes breakdowns by transaction size, value transferred, and computational complexity. This granular view helps identify network utilization patterns and predict future capacity requirements.
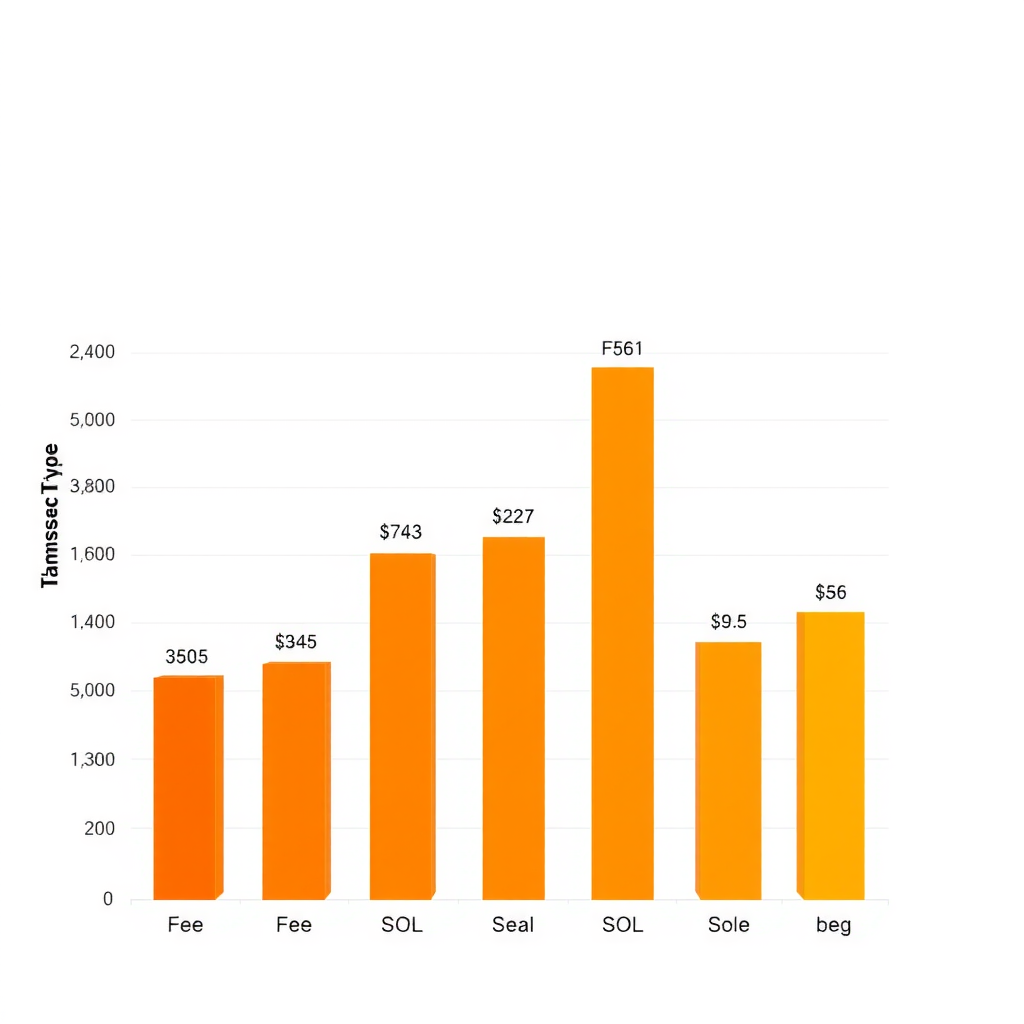
Fee Structure Analysis
Understanding transaction fees is crucial for optimizing blockchain operations and predicting costs. Our fee structure analysis provides detailed breakdowns of fee distributions, average costs per transaction type, and temporal variations in fee levels.
The dashboard tracks both base fees and priority fees, showing how users compete for block space during high-demand periods. This intelligence helps you optimize transaction timing and fee bidding strategies for cost-effective operations.
Fee analysis extends to program-specific costs, revealing which smart contract interactions carry higher computational overhead. This information is invaluable for developers optimizing their applications and for users planning complex transaction sequences.
Peak Usage Identification
Automatically identify peak usage periods and understand what drives network congestion. Our algorithms detect both predictable patterns and unexpected spikes, providing context for each event.
Success Rate Tracking
Monitor transaction success rates across different transaction types and time periods. Understand failure patterns and their causes to improve transaction reliability and user experience.
Program Interaction Analysis
Analyze how users interact with different programs and smart contracts. Track program popularity, usage patterns, and cross-program transaction flows for comprehensive ecosystem understanding.
Advanced Filtering Capabilities
The Transaction Analytics Dashboard offers sophisticated filtering options that allow you to drill down into specific aspects of blockchain activity. Create custom views that focus on exactly the data you need for your analysis.
⏱Time Period Filtering
Select custom date ranges, compare specific time periods, or use preset intervals like hourly, daily, weekly, monthly, and yearly views. The flexible time filtering system adapts to your analytical needs, whether you're examining minute-by-minute activity or long-term trends spanning years.
🔄Transaction Type Filtering
Filter by transaction types including transfers, program interactions, token operations, NFT transactions, and more. Isolate specific transaction categories to understand their unique patterns and characteristics within the broader network activity.
⚙Program Interaction Filtering
Focus on specific programs or smart contracts to analyze their usage patterns. Track interactions with DeFi protocols, NFT marketplaces, gaming applications, and other ecosystem components. Understand which programs drive network activity and how they interact with each other.
💰Value Range Filtering
Filter transactions by value ranges to focus on high-value transfers, micro-transactions, or any custom threshold. This capability helps identify whale activity, retail user behavior, and value distribution patterns across the network.
Ideal for Research and Institutional Analysis
The Transaction Analytics Dashboard is specifically designed to meet the demanding requirements of researchers, analysts, and institutional users who need comprehensive transaction intelligence for market analysis and strategic planning.
For Researchers
Access raw data exports, statistical analysis tools, and correlation matrices for academic research. Our platform supports rigorous analytical methodologies and provides the data quality and completeness required for peer-reviewed research.
Researchers benefit from comprehensive documentation, data provenance tracking, and reproducible analysis workflows that meet academic standards.
For Institutional Users
Institutional users gain access to enterprise-grade analytics, custom reporting capabilities, and integration options for existing analytical infrastructure. The dashboard supports portfolio analysis, risk assessment, and market intelligence gathering.
Advanced features include automated alert systems, anomaly detection, and predictive analytics that help institutions stay ahead of market movements.
Strategic Planning Intelligence
Whether you're planning market entry strategies, optimizing operational costs, or conducting competitive analysis, our Transaction Analytics Dashboard provides the intelligence foundation for informed strategic decisions. The combination of historical context, real-time monitoring, and predictive insights creates a comprehensive analytical environment that supports both tactical and strategic planning initiatives.
Unlock Deep Blockchain Insights
Transform raw transaction data into actionable intelligence with our powerful analytics platform. Join researchers, analysts, and institutions who rely on Sol View for comprehensive Solana network insights.
Experience the power of data-driven blockchain analysis today.